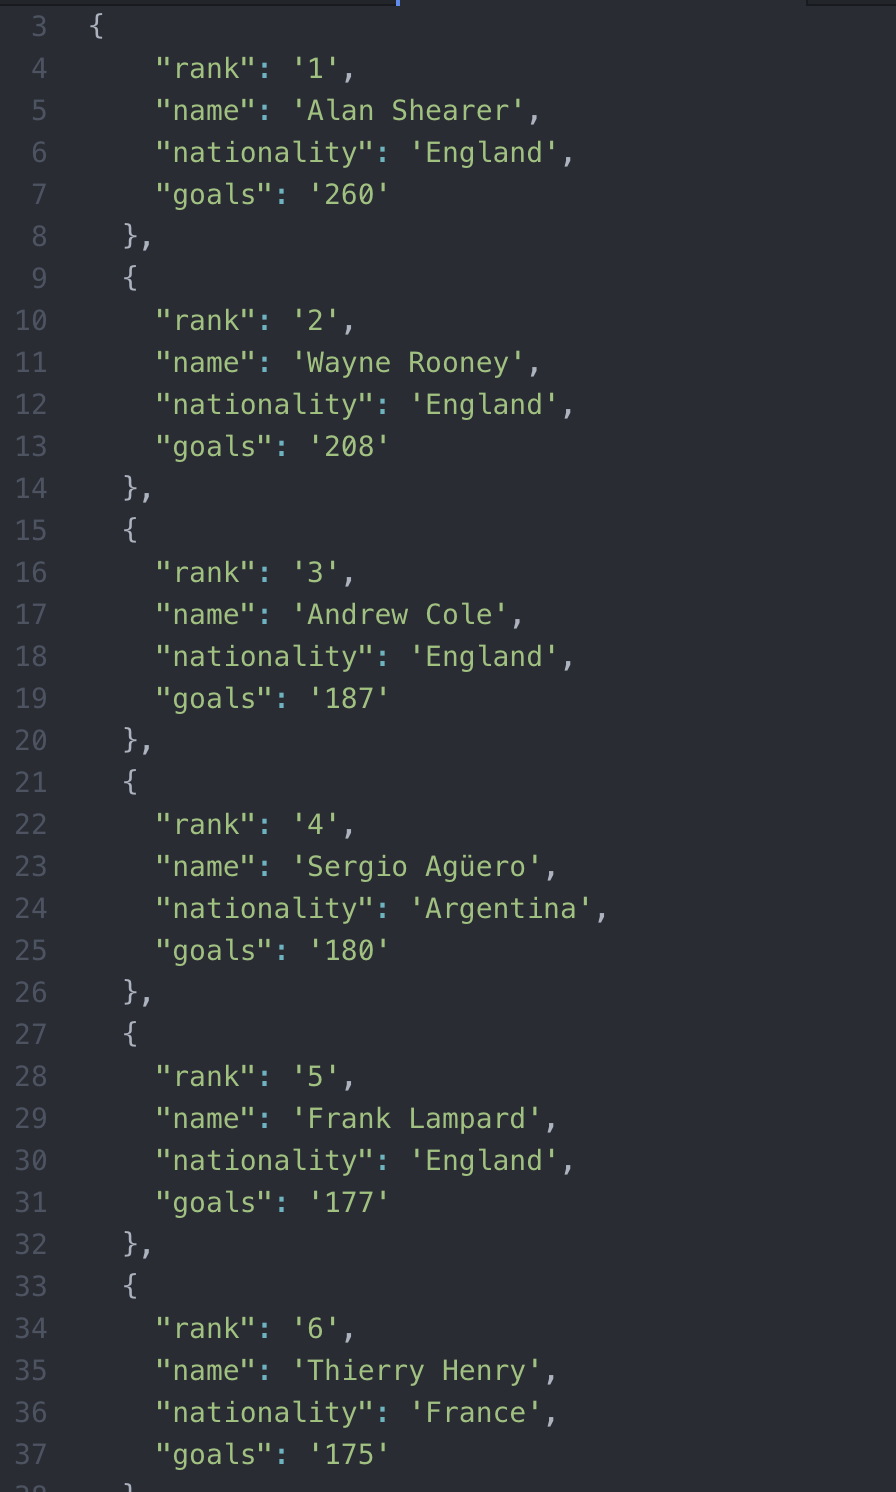
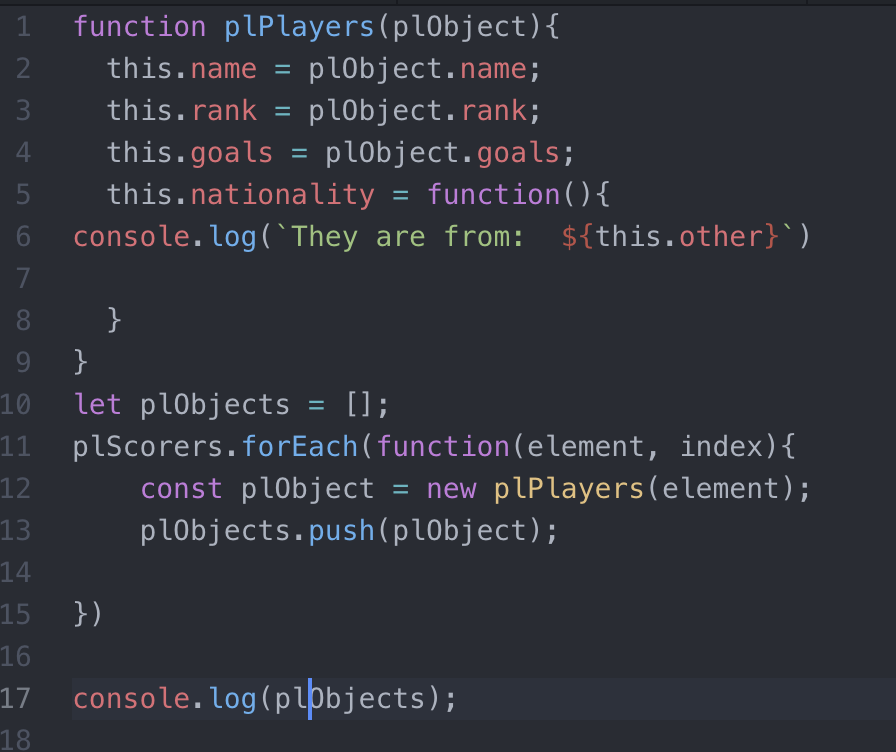
This assignment was a little tough for me to start and to complete. I didnt know what to do it on and I didnt want to base it off on my API assignment so I started to look for something new. After reading the article "The Ultimate Guide to Web Scraping with Node.js" I had a better understanding of CheerioJS and Puppeteer but I was still a bit confused on how to start things off. I tried to follow the examples from the last class and I decided to gather sports related data from a website so I can create a filter functionality for it. I used the Premier League website to gather the top 20 goal scorers of all time (rip sports) so using CheerioJS and axios I was able to gather the rank, player name, nationality, and goals. I put all this information in its own .js file and then set up a new .js file to create the filter. I just had a little trouble with applying the search function becuase when i was using examples online the search results would not come up on the front end. Ill update it very soon.
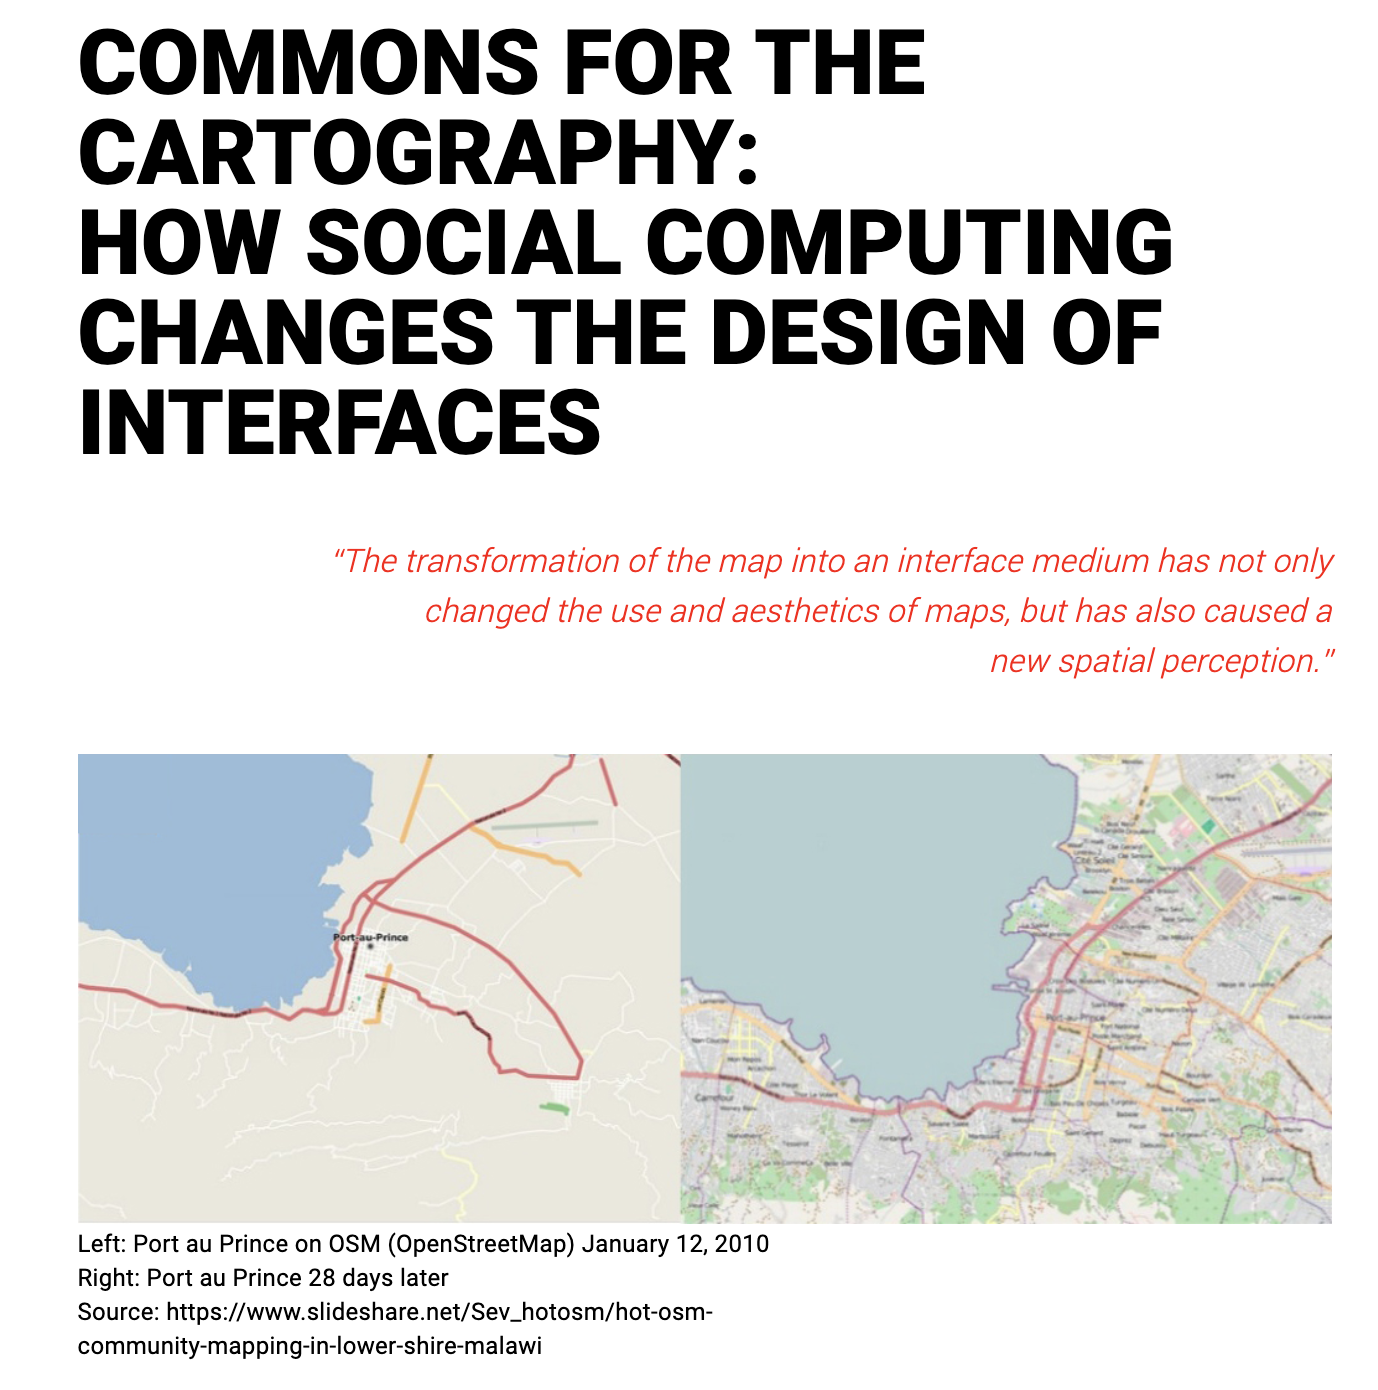
This article discussed about the transformation of Haiti's map due to the use of specific interfaces and along witht he help of mobile devices it helped updates the current area through geo referenced data. This article made me realize the importance of how web based mapping platforms help with data collection and provide a well needed service. I also didnt know about OSM so it was interesting to look it up and see how popular it is.
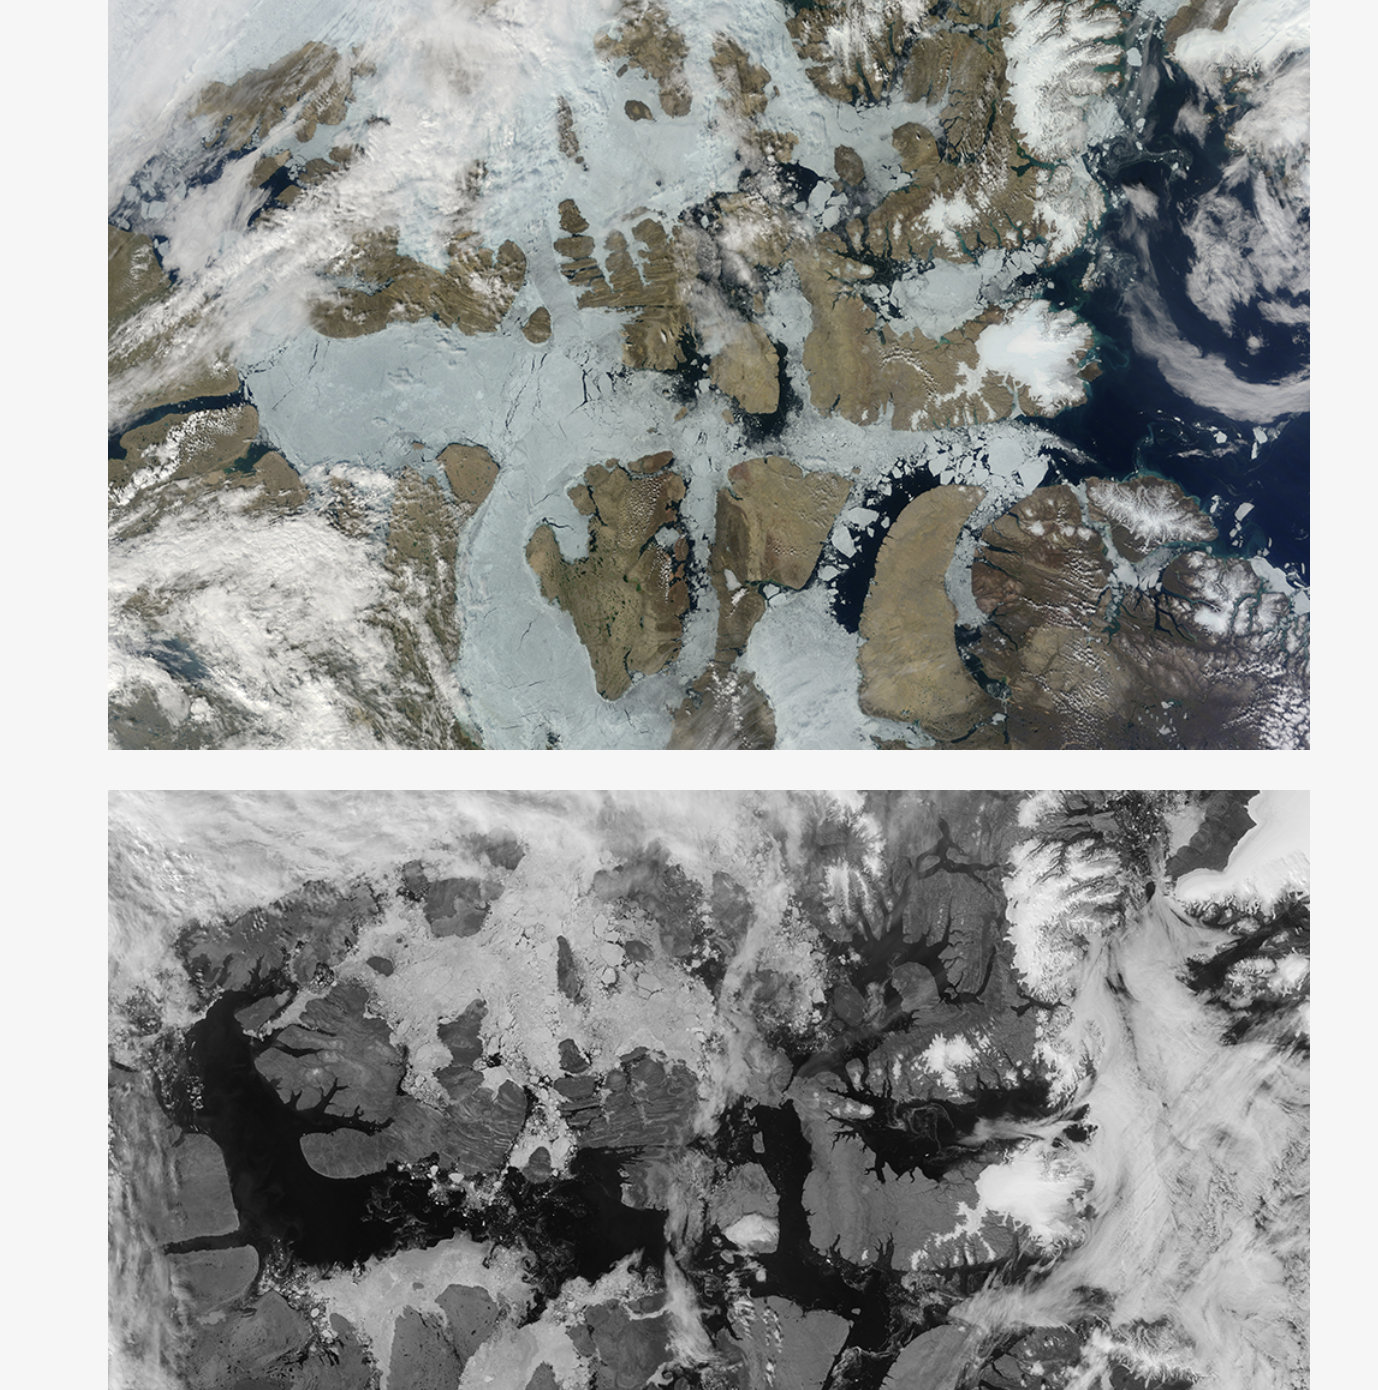
This was a very interesting article to read because visiual representation of this type of topic on climate change is a great way to show people the impact that it has rather than writing in text or putting up some data. Even though both ways serve the same purpose the representation method of using images has a much larger impact on the veiwer. My favorite comparison is the two images that show the decline of ice in Canada. I really shows the large amount of impact versus if someone said ice pack in Canada has decreased by some percentage.